Canary Checker Kubernetes Native Health Checks Beyond Monitoring
Introduction
Modern distributed applications rely on dozens of services, APIs, and external integrations. Traditional monitoring tools like Prometheus or Datadog detect when something is wrong after it happens, but wouldn’t it be better to proactively verify that your systems and integrations are working as expected
This is where Canary Checker comes in. It is a Kubernetes native health check platform designed to continuously validate services, infrastructure, and integrations through proactive canaries. Think of it as automated tests running inside your cluster, validating not only pods, but also databases, APIs, and external SaaS services.
What is Canary Checker
Canary Checker is a declarative health check system for Kubernetes, built to ensure your workloads and dependencies behave as expected.
- Runs synthetic, passive, infrastructure, and integration checks inside Kubernetes.
- Provides a unified dashboard and Prometheus metrics for observability.
- Designed for GitOps workflows, you define canary CRDs alongside other manifests.
Unlike simple readiness/liveness probes, Canary Checker validates end-to-end functionality across your entire stack.
Health Checks
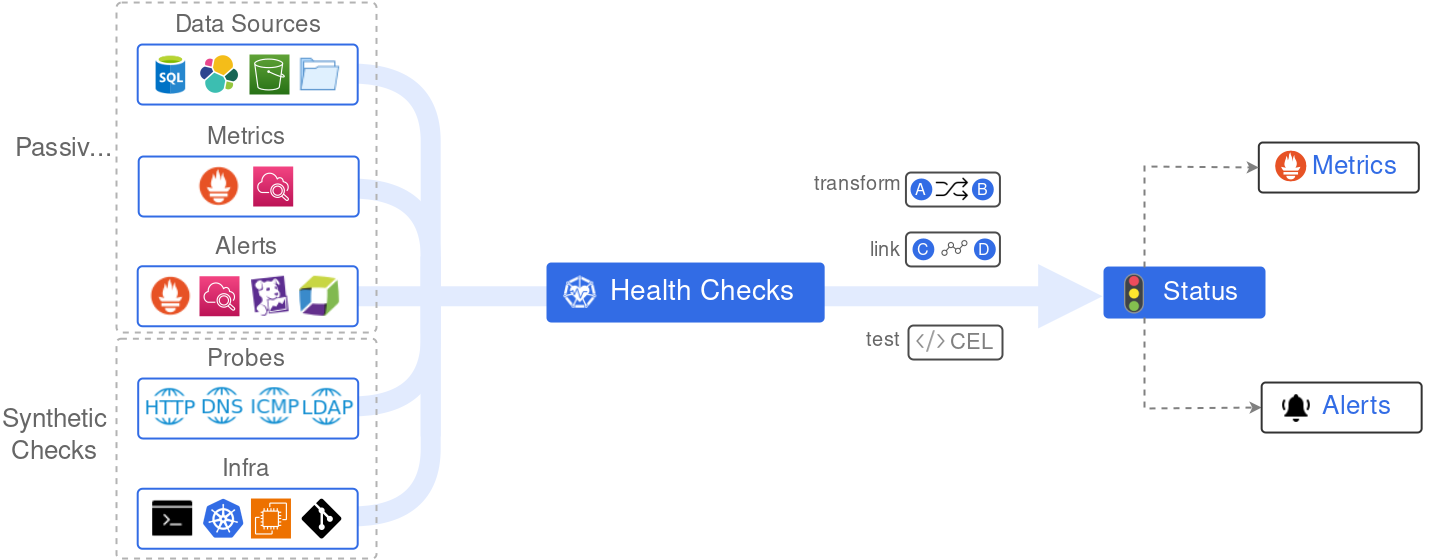
Types of Checks Supported
Synthetic (Active) Checks
- Actively probe endpoints or services.
- Examples: HTTP requests, SQL queries, MongoDB connections, LDAP logins.
- Catch issues before real users do.
Passive Checks
- Collect signals from existing monitoring/observability systems.
- Sources: Prometheus alerts, Datadog, CloudWatch, and Elasticsearch queries.
- Useful to consolidate alerts in one place.
Infrastructure Checks
- Validate cluster or cloud resource provisioning.
- Examples: create a pod or EC2 instance, then test readiness.
- Ensures autoscaling or infra provisioning pipelines actually work.
Integration Checks
- Run test suites for higher-level validation.
- Supports Playwright (UI tests), JUnit, Postman/Newman, K6 load tests.
- Ensures critical workflows (e.g., login → checkout → payment) still function.
Core Capabilities & Differentiators
Prometheus Metrics Exporter Built-In
Every canary automatically exports metrics. No need to wire separate exporters.
Scriptable Logic
Use CEL, JavaScript, or Go templates to customize pass/fail conditions. Example: Alert of API latency > 500ms and SSL cert expires within 7 days.
Dashboard & Visualization
Built-in dashboard shows real-time canary results. Works seamlessly with Grafana dashboards.
Seamless Kubernetes Integration
Canary checks are declarative CRDs, GitOps-friendly. Works with FluxCD, ArgoCD
Secret Management
Securely reference secrets via Kubernetes Secrets or ConfigMaps
Getting Started
Prerequisites
You need kubernetes cluster up and running, you can you use kind or any standard cloud distribution
Here, I have kind cluster
1
2
3
❯ kubectl config get-contexts
CURRENT   NAME   CLUSTER    AUTHINFO    NAMESPACE
*         kind   kind       kind
Install via Helm
1
2
❯ helm repo add flanksource [https://flanksource.github.io/charts](https://flanksource.github.io/charts)
"flanksource" has been added to your repositories
1
2
3
4
5
6
7
❯ helm install canary-checker flanksource/canary-checker -n canary-checker --create-namespace
NAME: canary-checker
LAST DEPLOYED: Fri Aug 29 17:57:06 2025
NAMESPACE: canary-checker
STATUS: deployed
REVISION: 1
TEST SUITE: None
1
2
3
❯ helm list -n canary-checker
NAME              NAMESPACE         REVISION    UPDATED                                 STATUS      CHART                   APP VERSION
canary-checker    canary-checker    1           2025-08-29 17:57:06.359401 +0530 IST    deployed    canary-checker-1.1.1    1.1.1
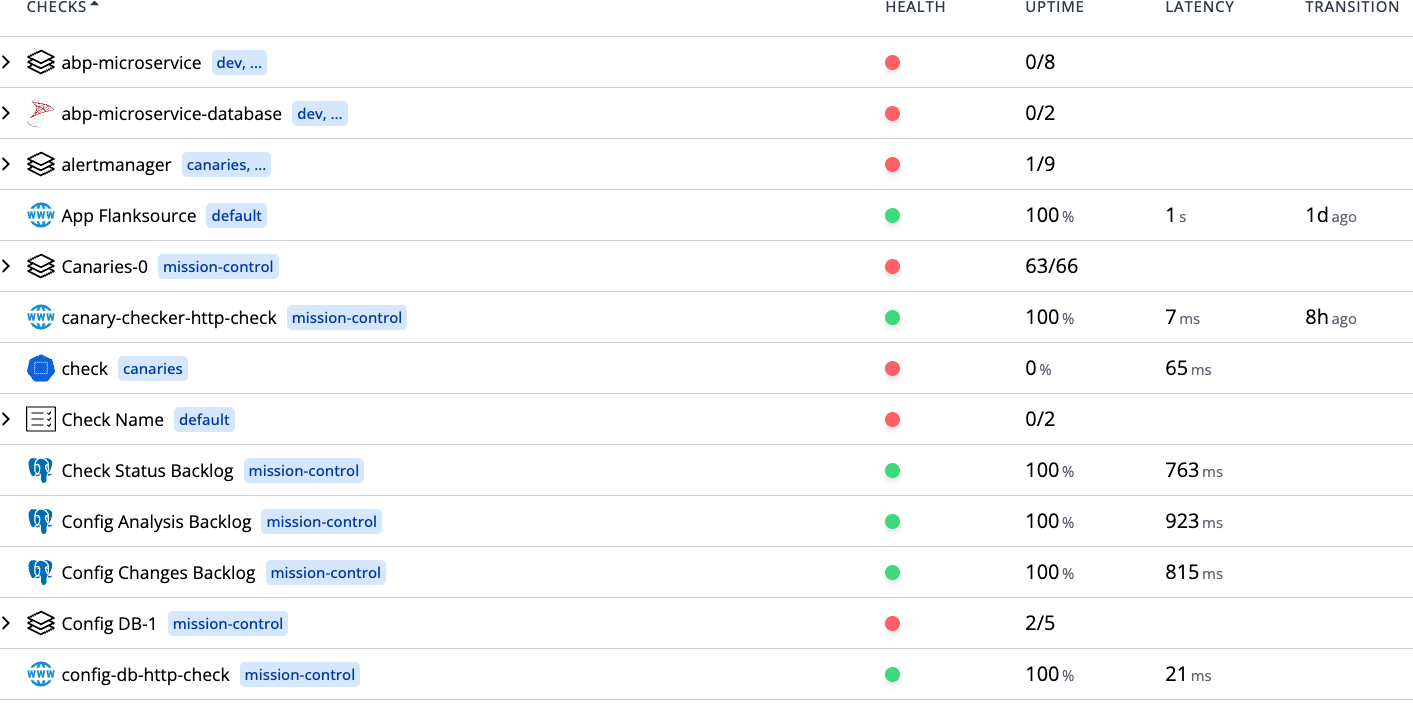
Check Results
List services
1
2
3
4
  ❯ kubectl get svc -n canary-checker
NAME                TYPE        CLUSTER-IP     EXTERNAL-IP   PORT(S)    AGE
canary-checker      ClusterIP   10.96.61.129   <none>        8080/TCP   4d22h
canary-checker-ui   ClusterIP   10.96.148.84   <none>        80/TCP     4d22h
Port-forward the UI:
kubectl port-forward svc/canary-checker 8080:80801 2 3 4 5 6 7 8 9
❯ kubectl -n canary-checker port-forward svc/canary-checker-ui 8080:80 Forwarding from 127.0.0.1:8080 -> 3000 Forwarding from [::1]:8080 -> 3000 Handling connection for 8080 Handling connection for 8080 Handling connection for 8080 Handling connection for 8080 Handling connection for 8080 Handling connection for 8080
Or check metrics at
/metricsendpoint.
Use Cases
HTTP Check
Verify website returns 200 within latency limits
1
2
3
4
5
6
7
8
9
10
11
apiVersion: canaries.flanksource.com/v1
kind: Canary
metadata:
  name: http-check
spec:
  schedule: "@every 30s"
  http:
    - name: basic-check
      url: https://httpbin.flanksource.com/status/200
    - name: failing-check
      url: https://httpbin.flanksource.com/status/500
1
2
❯ k apply -f canary.yaml
canary.canaries.flanksource.com/http-check created
Custom Metrics
Monitor external data (e.g., exchange rates) and expose them as Prometheus metrics.
1
2
3
4
5
6
7
8
9
10
11
12
13
14
15
16
17
18
19
20
21
22
23
24
25
26
27
28
29
30
31
32
33
34
35
36
37
38
39
apiVersion: canaries.flanksource.com/v1
kind: Canary
metadata:
  name: exchange-rates
spec:
  schedule: "every 30 @minutes"
  http:
    - name: exchange-rates
      url: https://api.frankfurter.app/latest?from=USD&to=GBP,EUR,ILS
      metrics:
        - name: exchange_rate
          type: gauge
          value: json.rates.GBP
          labels:
            - name: "from"
              value: "USD"
            - name: to
              value: GBP

        - name: exchange_rate
          type: gauge
          value: json.rates.EUR
          labels:
            - name: "from"
              value: "USD"
            - name: to
              value: EUR

        - name: exchange_rate
          type: gauge
          value: json.rates.ILS
          labels:
            - name: "from"
              value: "USD"
            - name: to
              value: ILS
        - name: exchange_rate_api
          type: histogram
          value: elapsed.getMilliseconds()
1
2
❯ k apply -f exchange-rates-exporter.yaml
canary.canaries.flanksource.com/exchange-rates created
Kubernetes
Check dns pod in kubernetes cluster
1
2
3
4
5
6
7
8
9
10
11
12
13
14
15
16
apiVersion: canaries.flanksource.com/v1
kind: Canary
metadata:
  name: checks-dns
spec:
  replicas: 1
  schedule: '@every 30s'
  kubernetes:
    - name: Monitor DNS pods
      kind: Pod
      healthy: true
      resource:
        labelSelector: k8s-app=kube-dns
      namespaceSelector:
        name: kube-system
      display: {}
1
2
❯ k apply -f checks-dns.yaml
canary.canaries.flanksource.com/checks-dns created
Infrastructure Validation
Test new pod/namespace creation after autoscaler events.
List all the canries and verify
1
2
3
4
5
❯ kubectl get canaries.canaries.flanksource.com
NAME             INTERVAL   STATUS   LAST CHECK   UPTIME 1H   LATENCY 1H   LAST TRANSITIONED
checks-dns
exchange-rates
http-check-new   30
Comparison: Canary Checker vs Alternatives
| Feature / Tool | Canary Checker | Prometheus + Alertmanager | Flagger | Argo Rollouts |
|---|---|---|---|---|
| Kubernetes-native | ✅ CRDs, GitOps | ❌ (needs exporters) | ✅ | ✅ |
| Synthetic Checks | ✅ HTTP, DB, LDAP | ❌ Only metrics-based | ❌ | ❌ |
| Passive Checks | ✅ Ingest from Prom, Datadog, CloudWatch | ✅ Prometheus only | ❌ | ❌ |
| Integration Tests | ✅ JUnit, Newman, Playwright | ❌ | ❌ | ❌ |
| Infrastructure Checks | ✅ Pods, EC2, Cloud | ❌ | ❌ | ❌ |
| Metrics Exporter | ✅ Built-in | ✅ via exporters | ✅ | ✅ |
| Focus | End-to-end health | Metrics collection & alerts | Progressive delivery | Progressive delivery |
| Best For | Full-stack validation | Metrics-based monitoring | Canary deployments | Canary deployments |
When to Use Canary Checker vs Alternatives
- Use Canary Checker if you want simple, Kubernetes-native, declarative checks.
- Use Flagger/Argo Rollouts if your focus is progressive delivery (not just monitoring).
- Use Kayenta/Spinnaker if you need large-scale automated analysis.
- Use Prometheus DIY/SaaS if you want flexibility or managed monitoring.
Conclusion
Canary Checker brings a new layer of reliability to Kubernetes by proactively checking not only your workloads but also your dependencies, infrastructure, and business-critical workflows. It does not replace existing monitoring and deployment tools.